
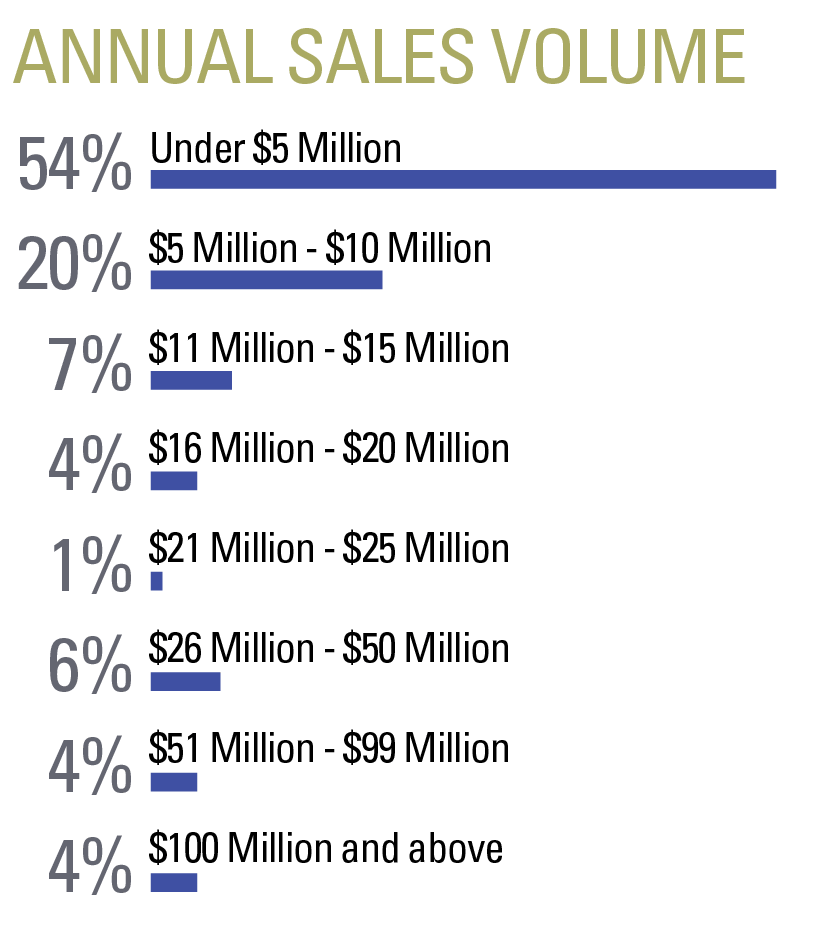
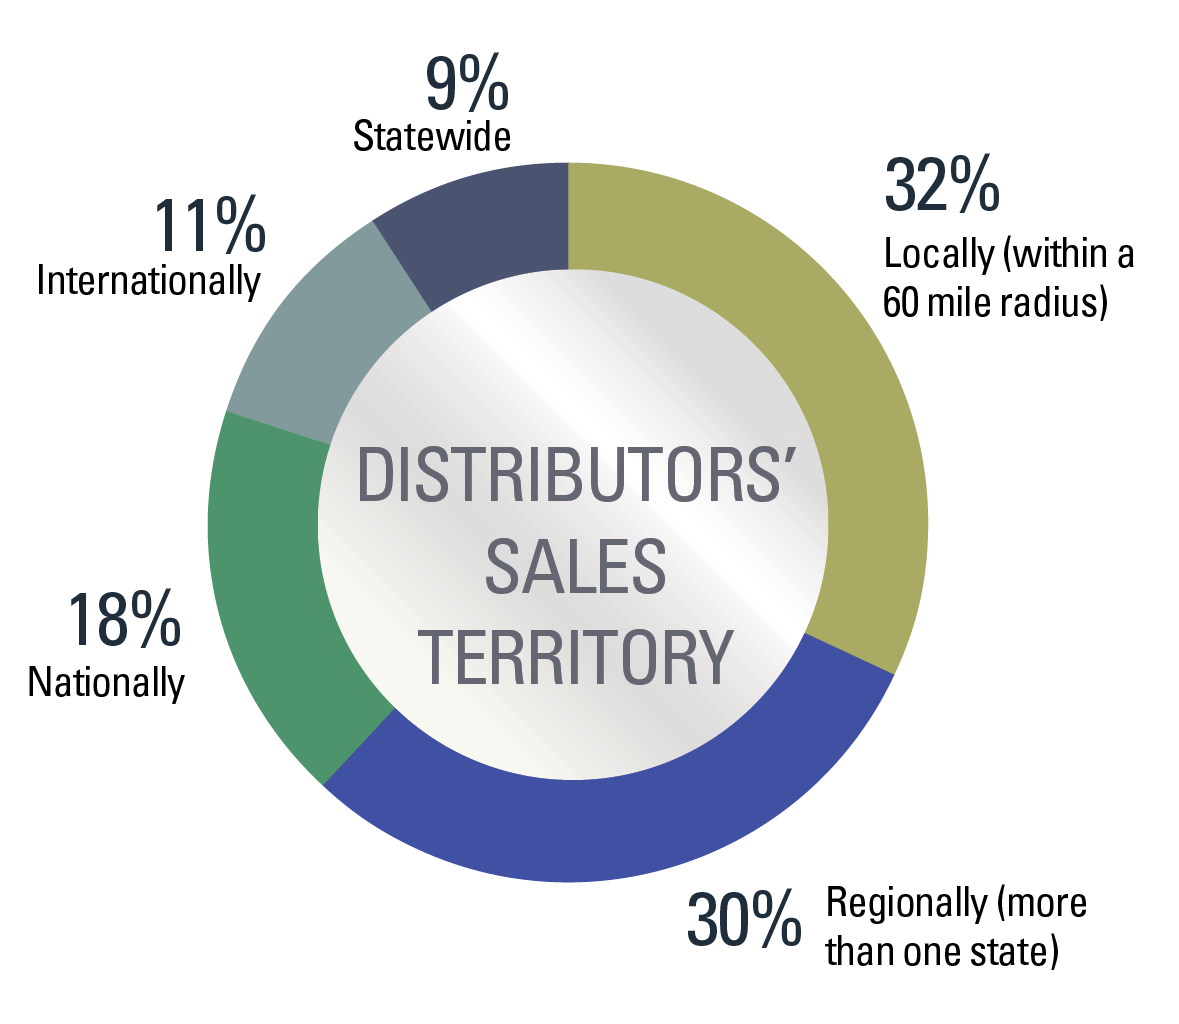
The "Report On 2018 Sanitary Supply Distributor Sales" was designed, prepared and conducted by the Research Department of Trade Press Media Group, publisher of Sanitary Maintenance, in conjunction with ISSA. Its primary purpose was to gather information on sales of chemicals, janitorial supplies, paper/plastic products and power equipment by distributors based in the United States.
Data was derived from nonduplicated questionnaires returned from a random sample of Sanitary Maintenance, readers, which includes ISSA members. The included dollar figures represent sales by distributors after markup.
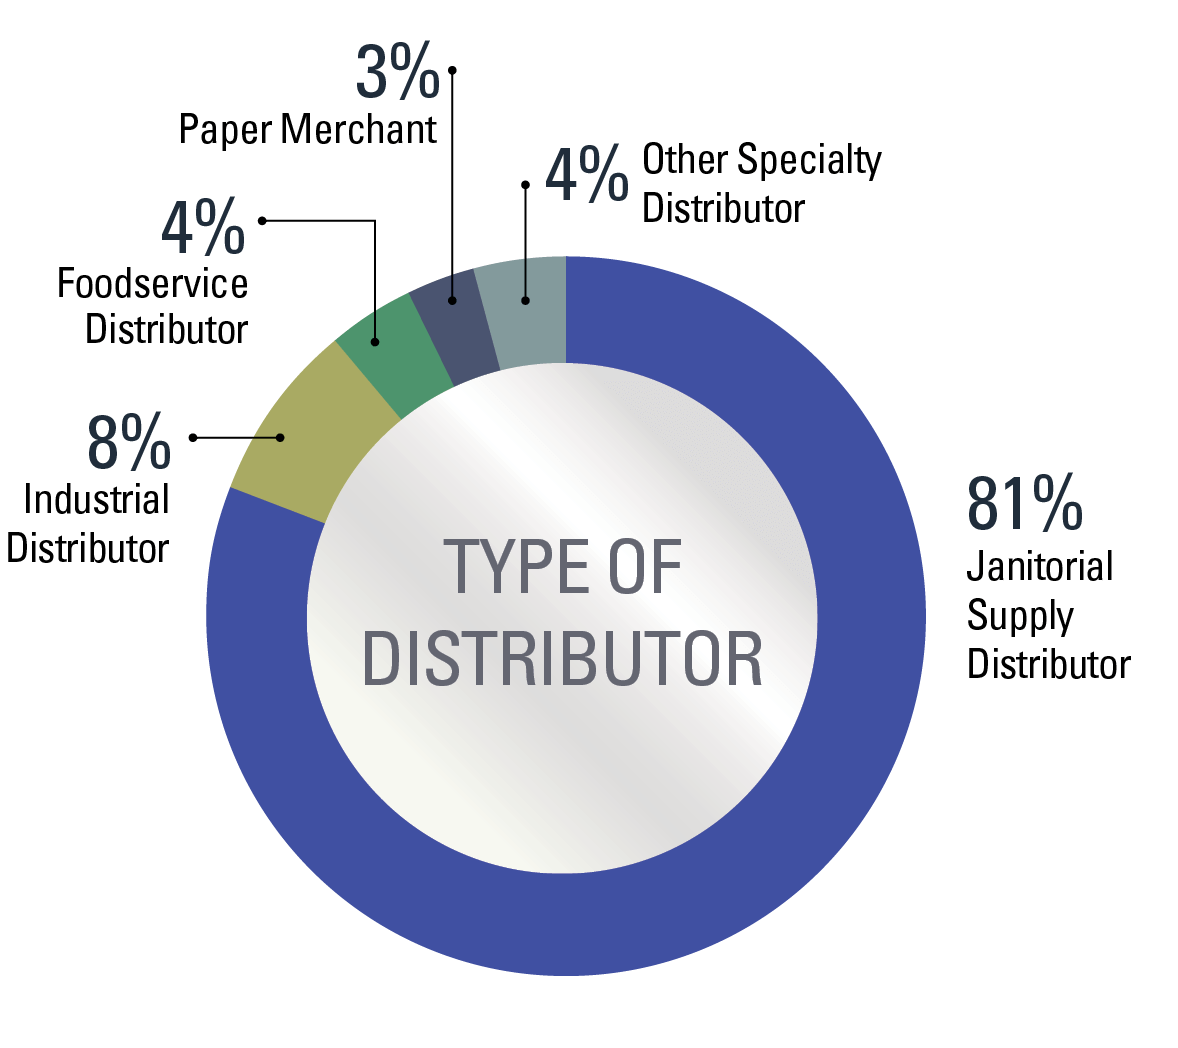
Market totals were computed using weighted means and projected against a universe of 5,500 distributors. The majority of this universe are distributors who consider jan/san supplies to be their primary product category; the remainder are distributors who consider jan/san to be their secondary product category. Survey results mimic this makeup with 81 percent of respondents indicating they are a janitorial supply distributor.
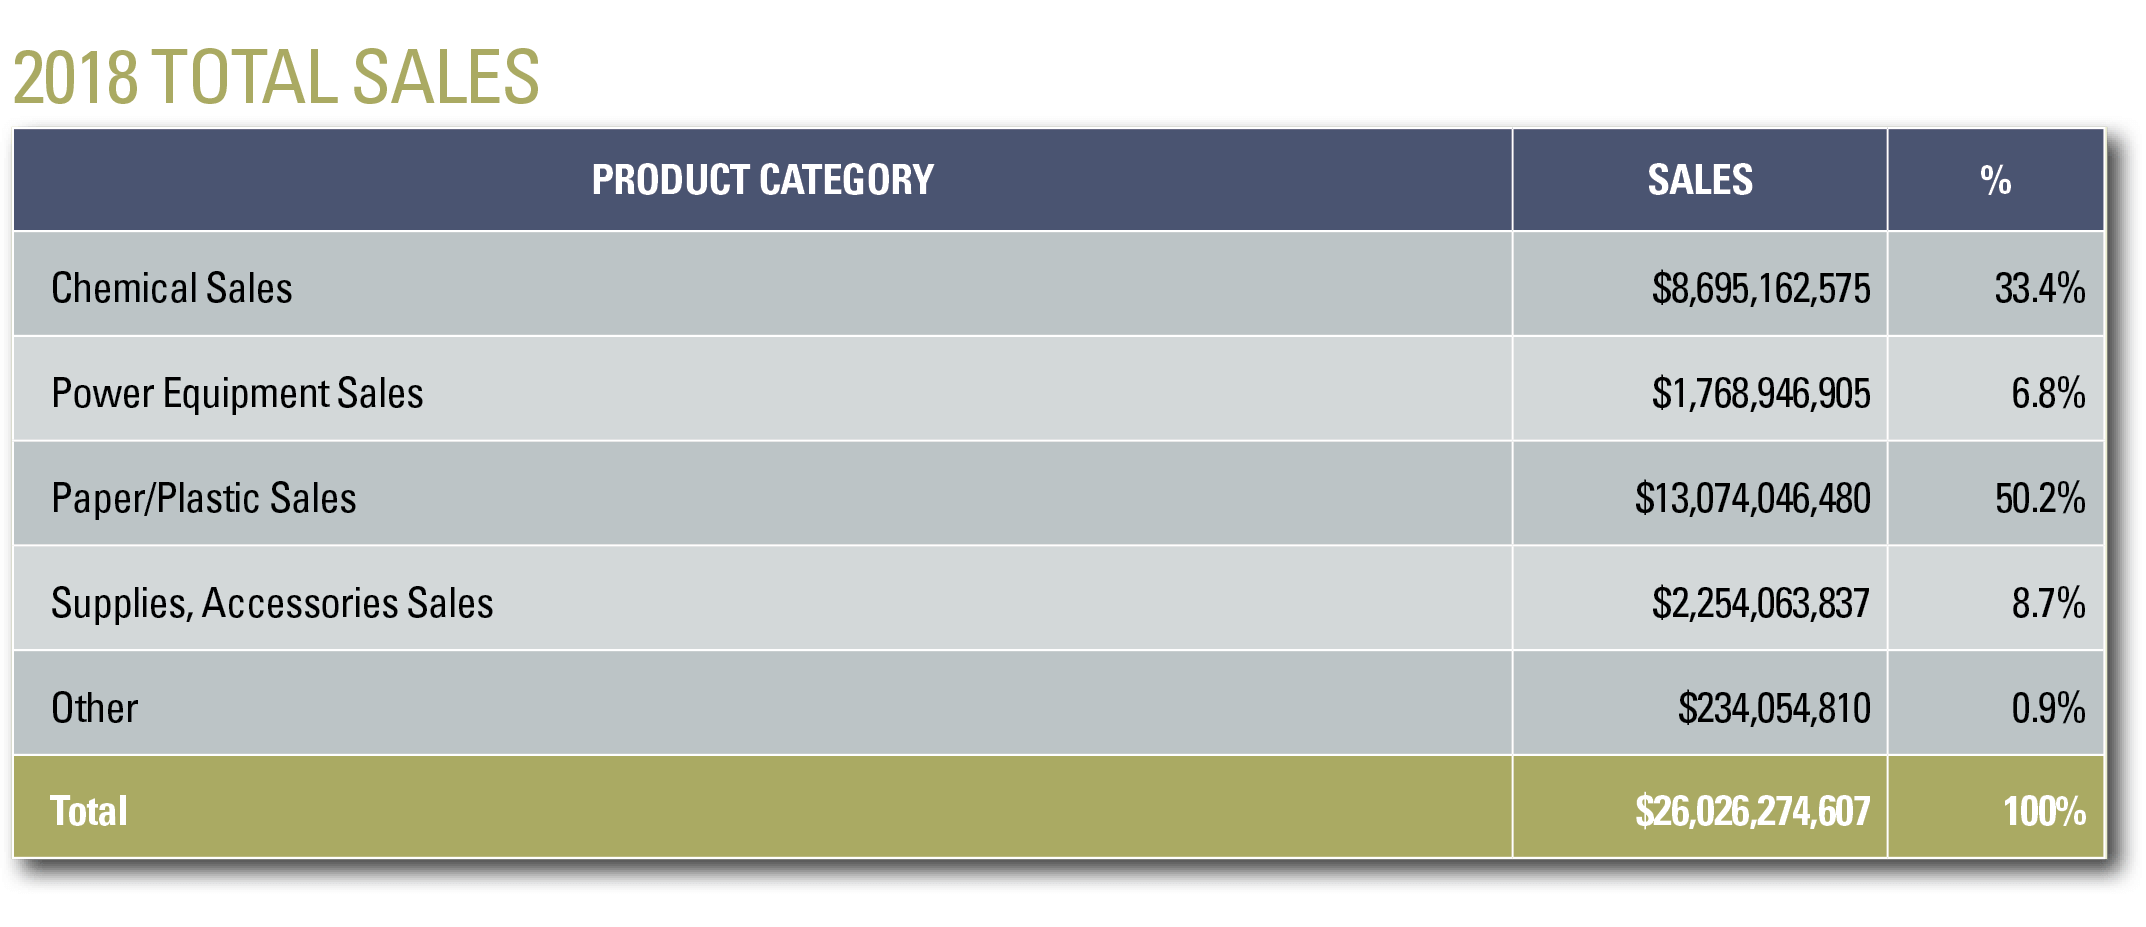
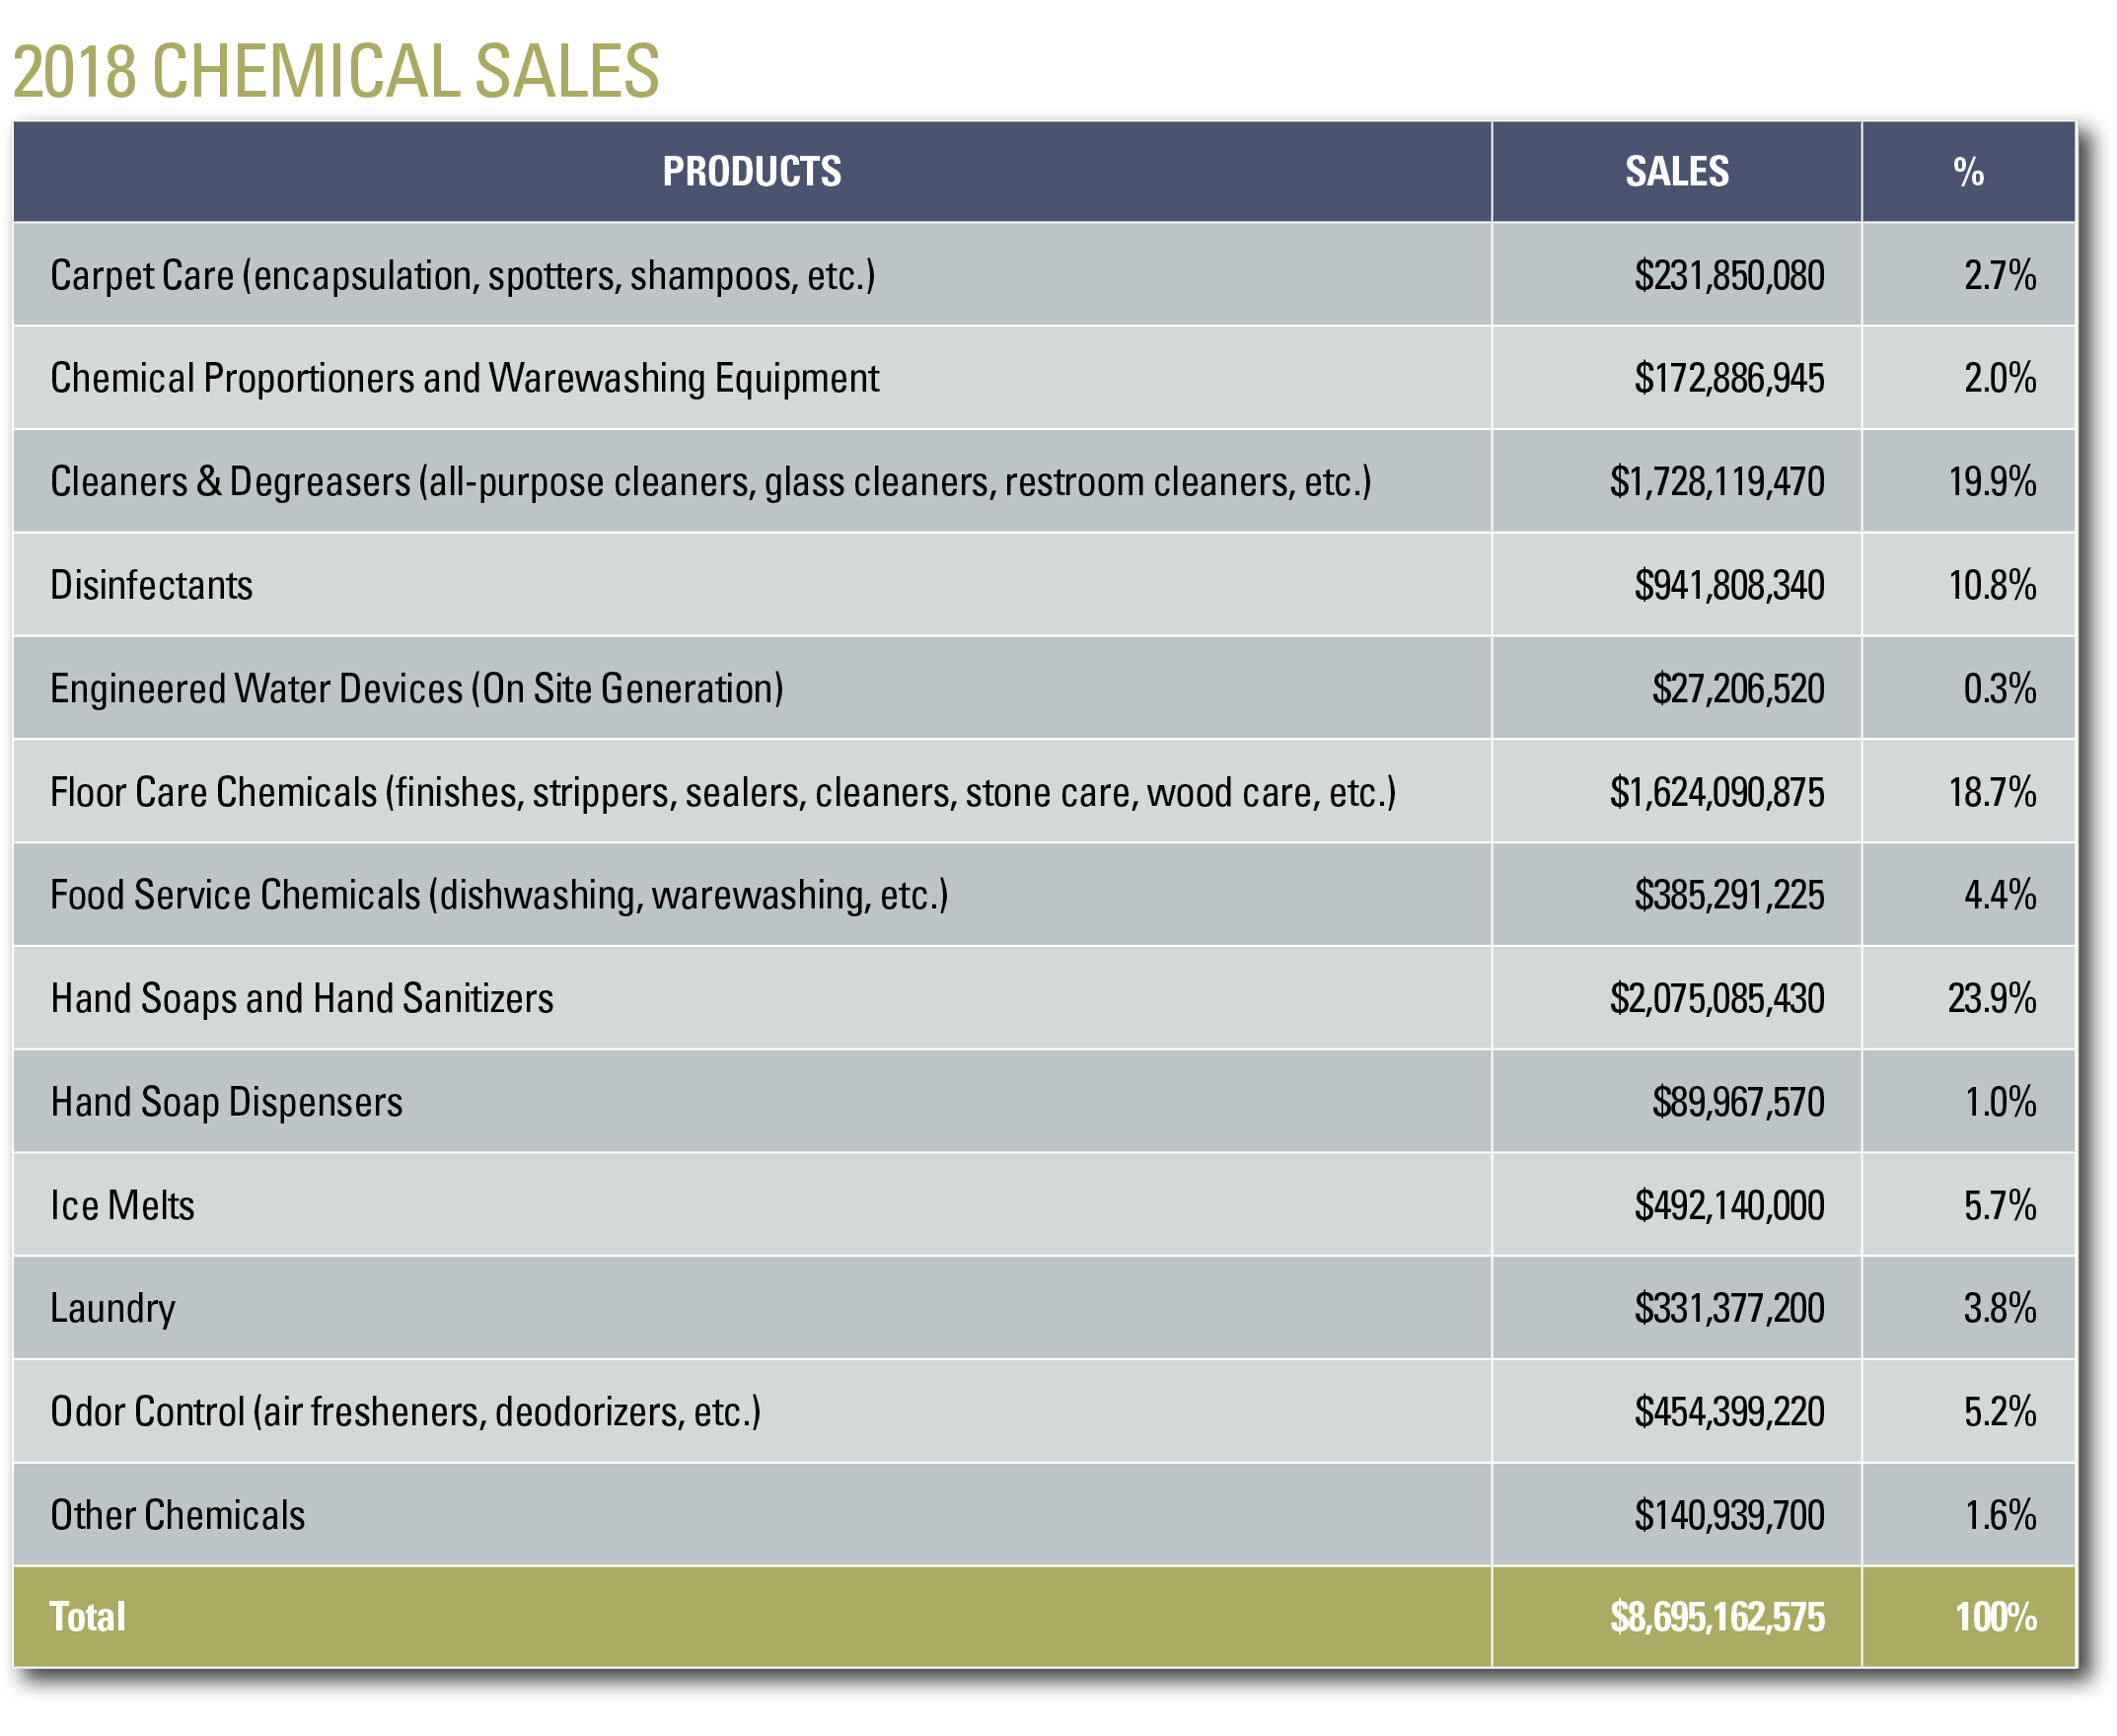
Comparing this report to its predecessor that focused on 2016 numbers, distributor sales continue to modestly increase. The $26.02 billion total is a 1.4 percent growth from 2016 numbers.
The threat of Amazon looms large over many industries, jan/san included. However, as other recent studies have shown, in-house cleaning facility managers and building service contractors prefer doing business with a traditional jan/san distributor over a faceless, giant e-tailer. It's no surprise then that distributors continue to hold steady with product sales rather than lose ground to competitors from outside the industry.
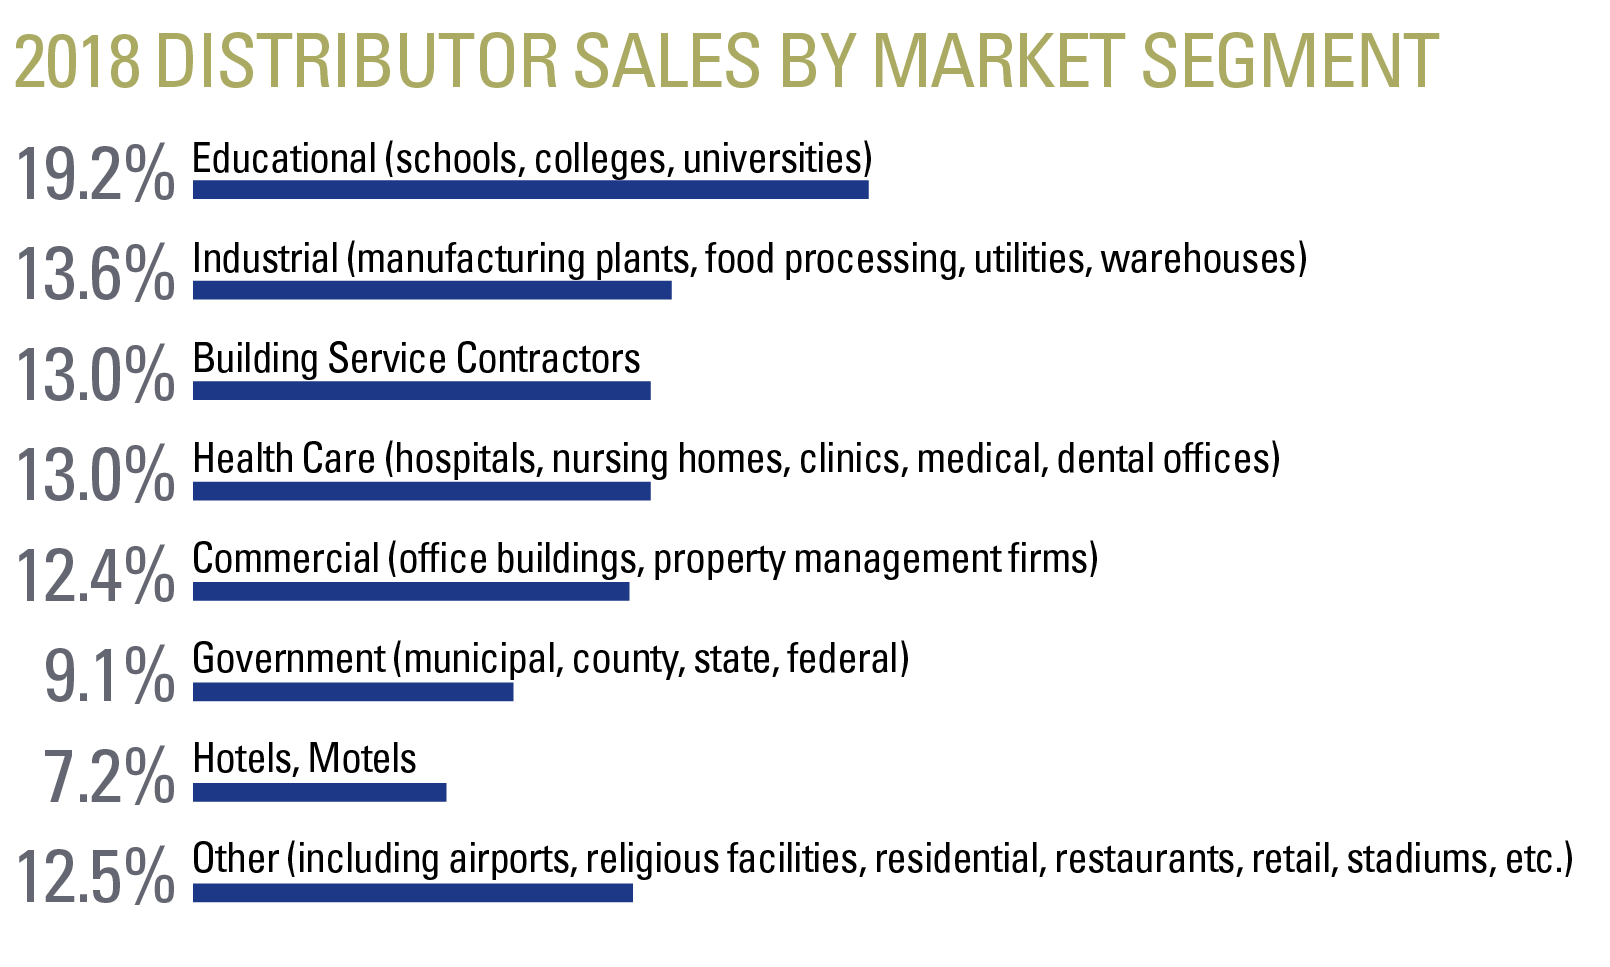
The education market remains the largest customer for distributors, and healthcare facilities also make up a significant share. Product and equipment purchasing accounted for 19 percent of these in-house cleaning departments' overall budgets in 2018, according to that year's "Annual Facility Cleaning Decisions Management Survey."
The contract cleaning industry remains a strong customer base for distributors, too. Year after year, BSCs see higher sales and profits over the previous year. For example, 65 percent of BSCs experienced higher sales in 2018 and profits were higher that year for 62 percent of contractors, according to the "2018 Report On The Building Service Contractor Market," from Contracting Profits and BSCAI.
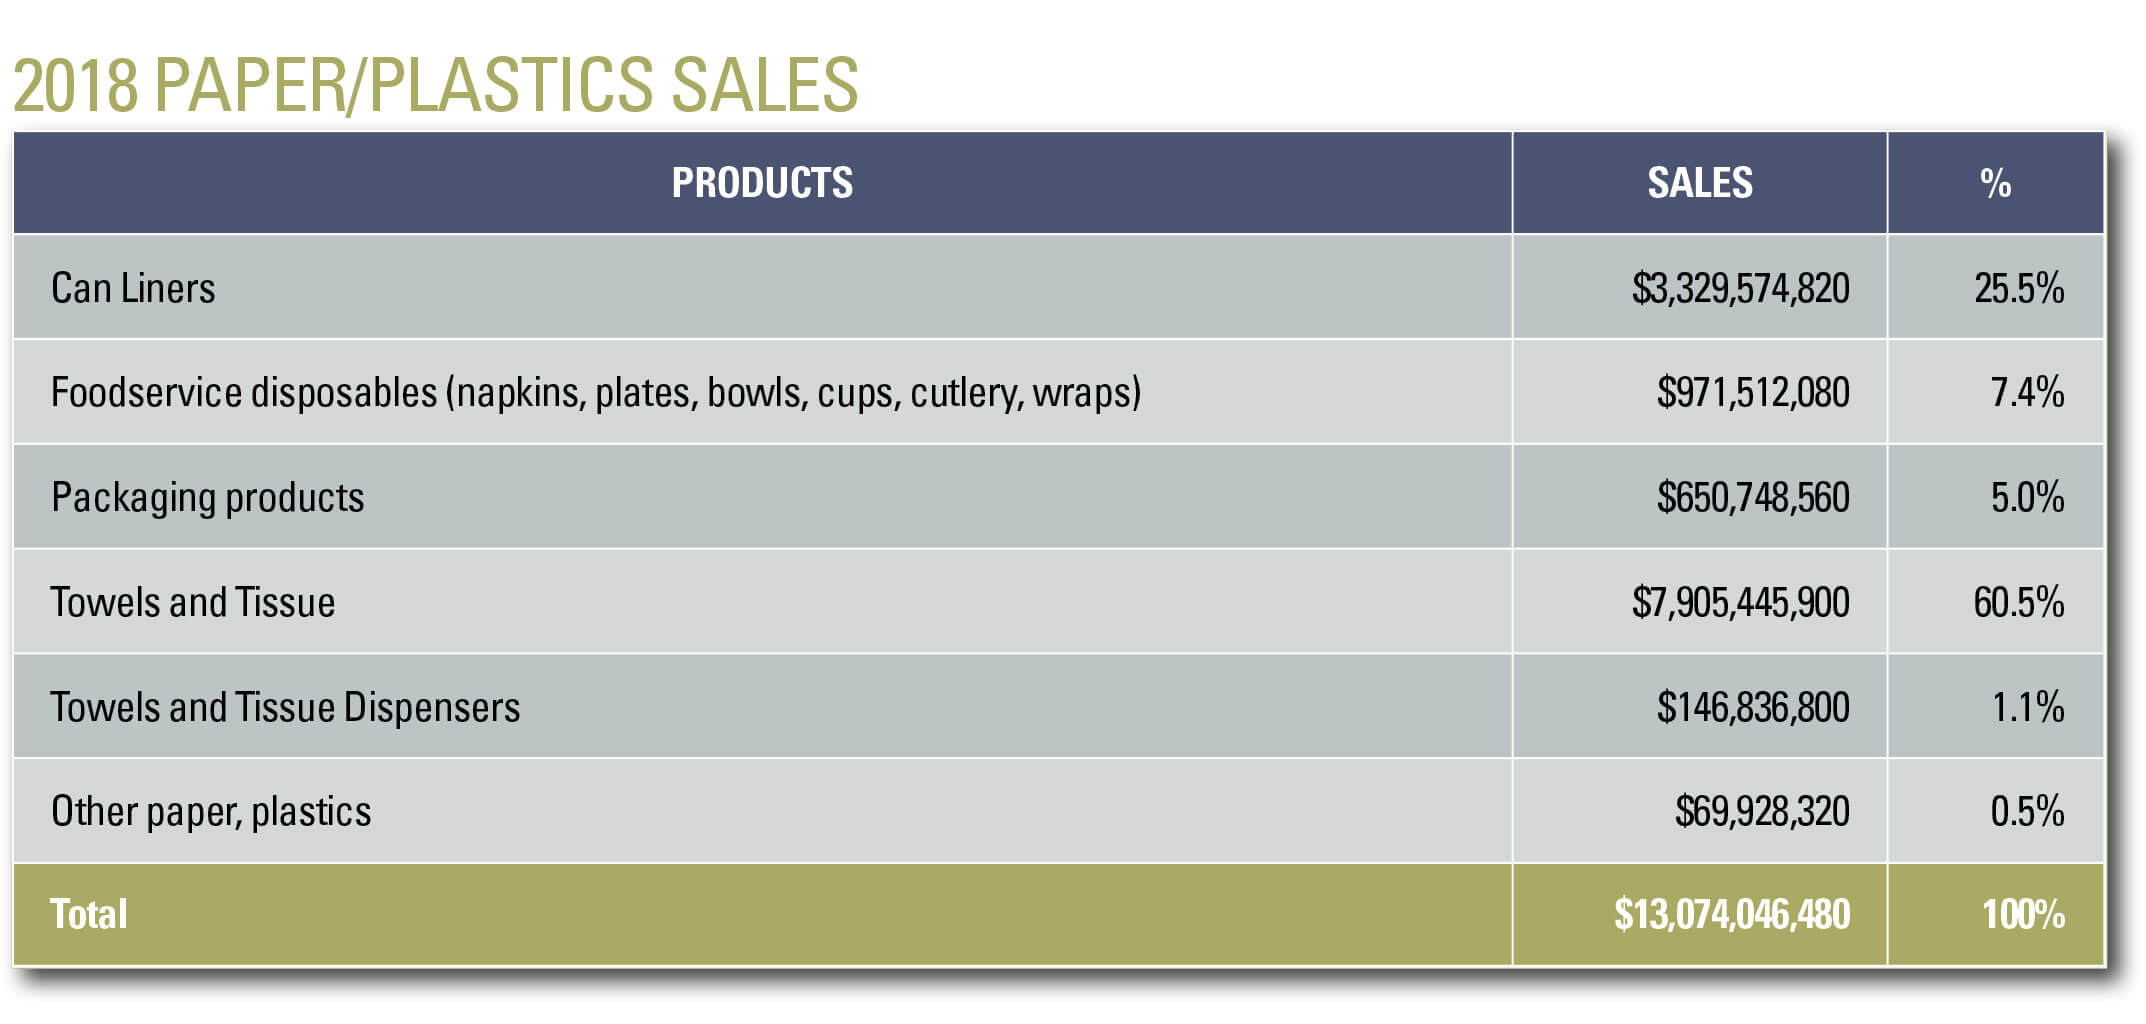
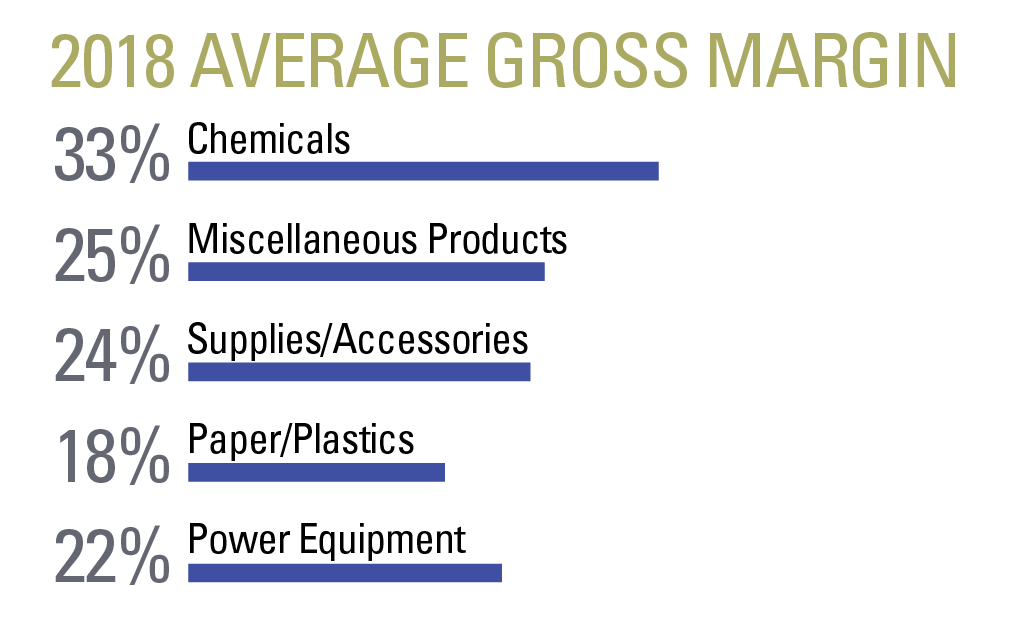
Although purchasing budgets may have remained steady for the majority of in-house facilities, in 2018, it was the focus of many departments to make cost-concious purchasing decisions. According to the "2018 Annual Facility Cleaning Decisions Management Survey," a quarter of facility cleaning managers indicated they would purchase lower-priced, off-brand consumables, such as paper, chemicals and soap to comply with lower budgets. This rationale could account for a dip in towels and tissue, or explain less-than-expected growth for cleaners and degreasers.
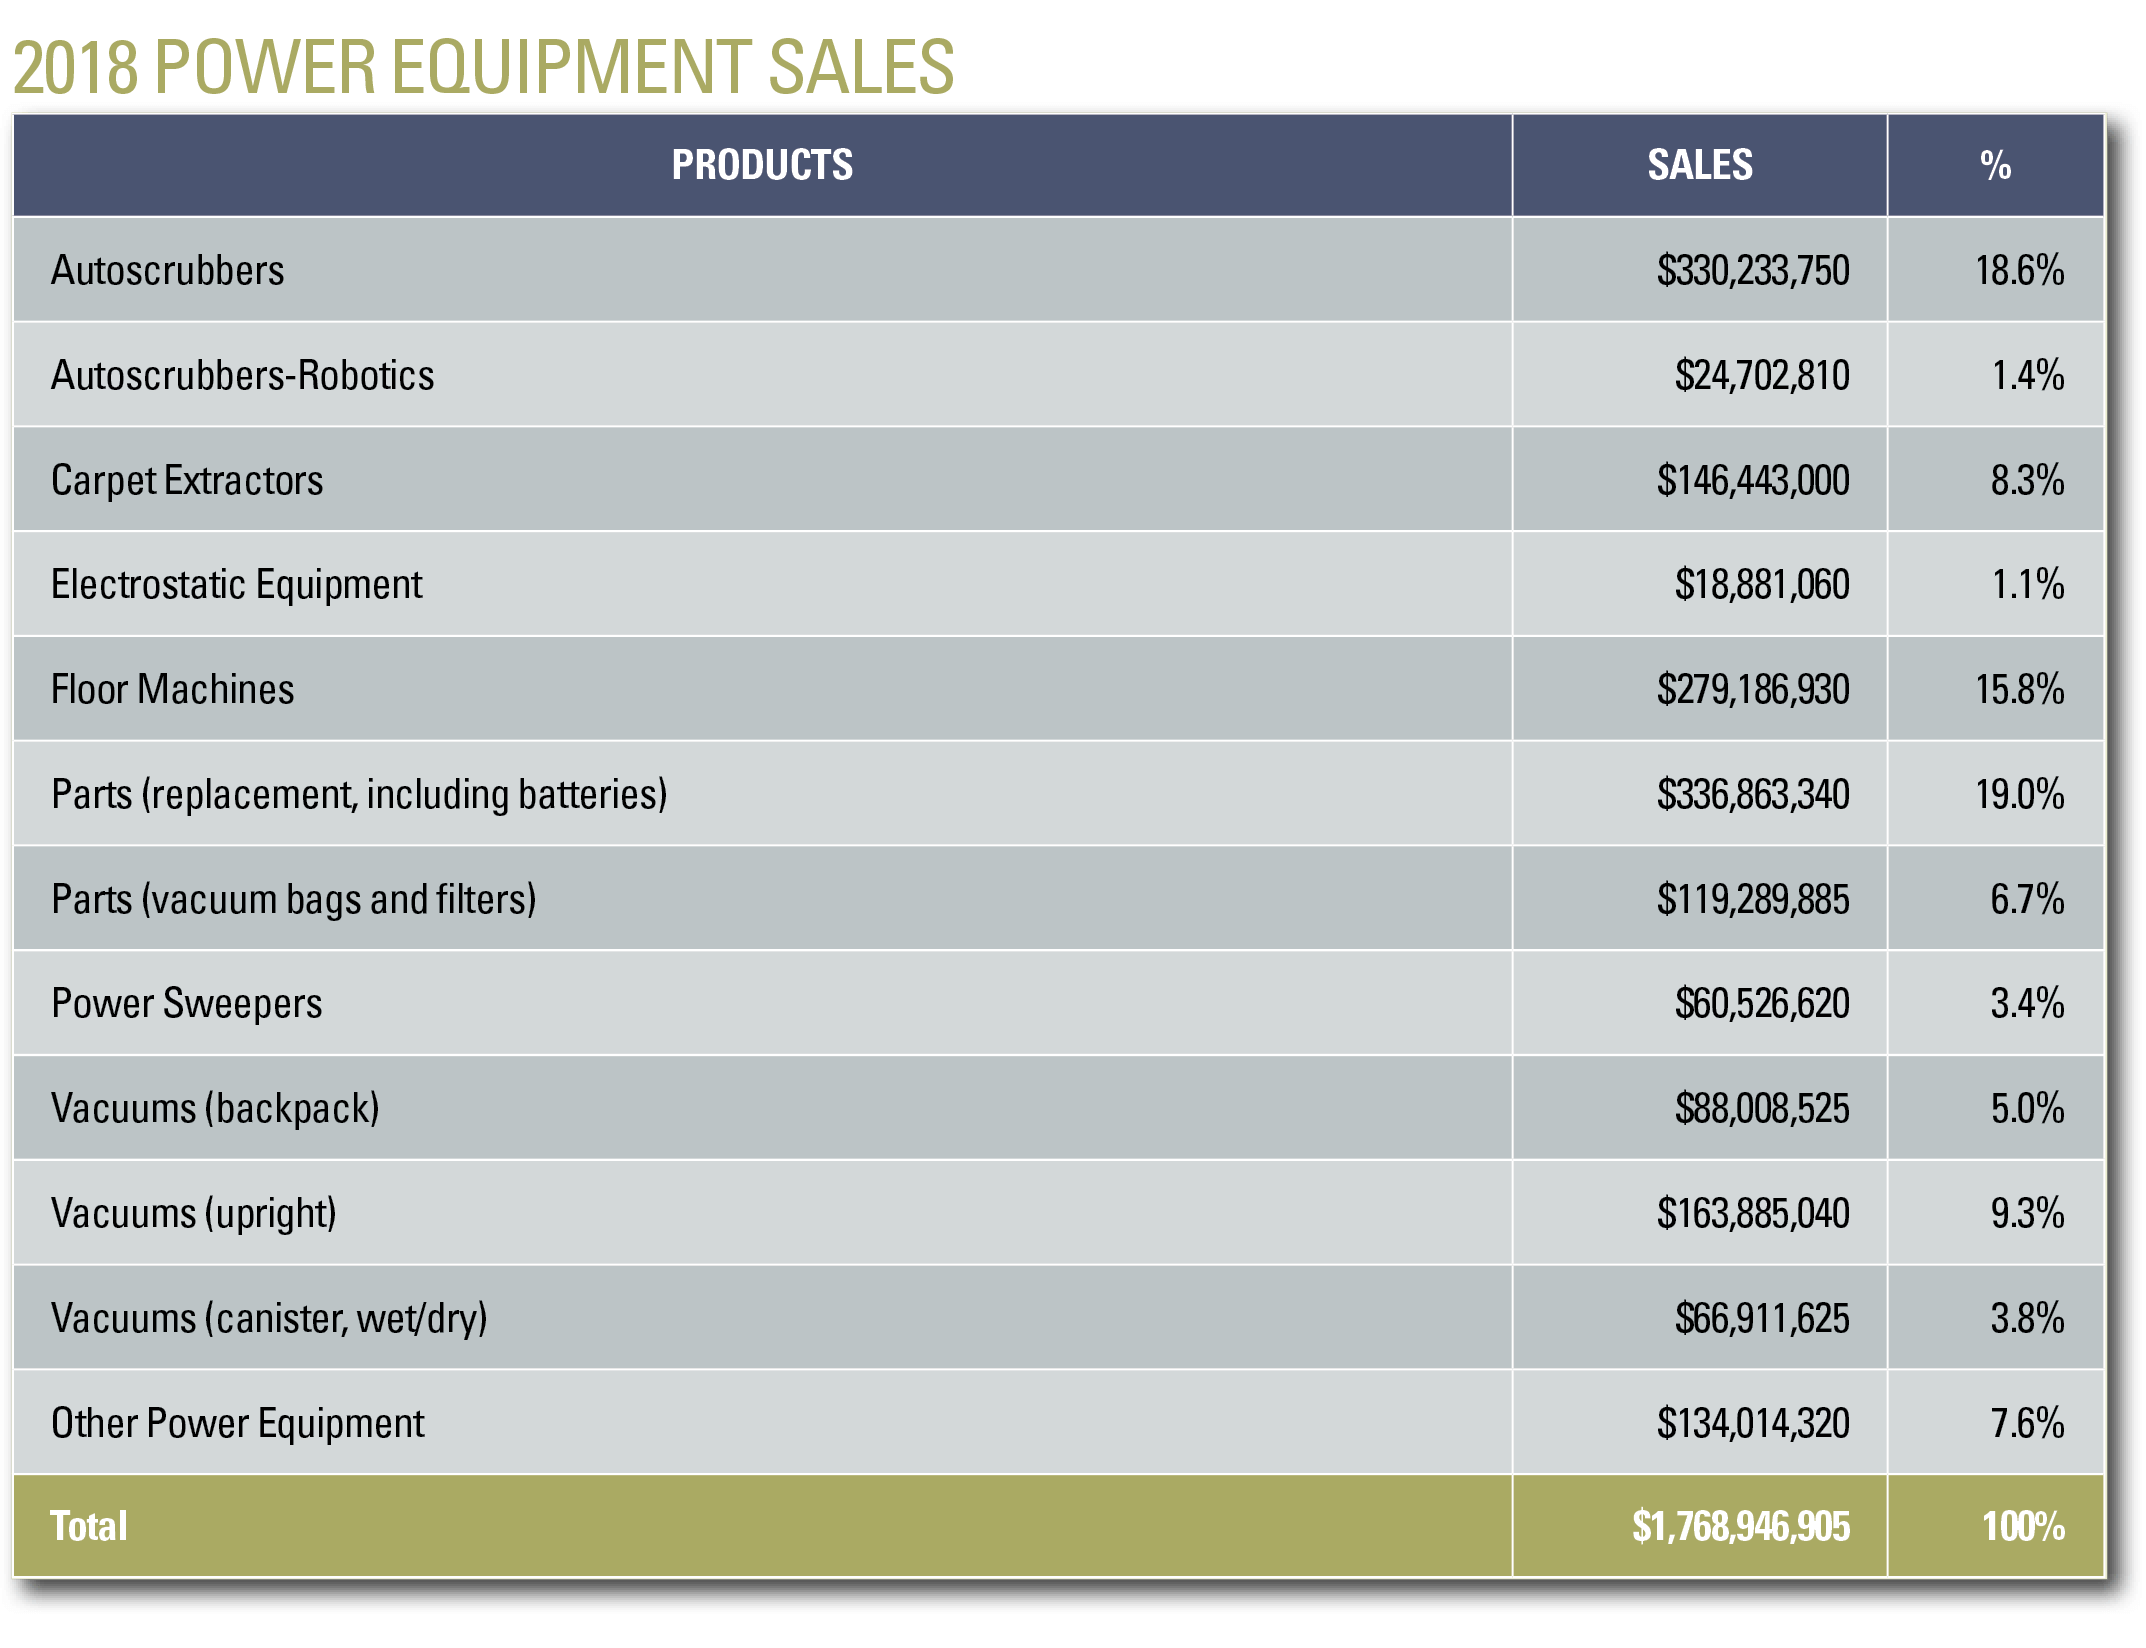
In this same year, in-house cleaning staffs reported adjusting their purchasing priorities to products that provided efficiencies. This can be seen with the adoption of new technology, such as robotic autoscrubbers and electrostatic equipment. In addition, 2018 saw the end of one of the deadliest flu seasons and the start of one of the longest. For many BSCs, electrostatic equipment became a new tool to quickly and effectively disinfect high-touch surfaces, while also providing customers peace of mind. This is the first time this report has gathered sales figures for these two products, yet both have already experienced respectable numbers.
Continuing to look at power equipment sales, batteries are only one aspect of the "Parts" category, but considering the myriad cordless products entering the market and improvements in battery technology, it makes sense this product category saw substantial sales growth since 2016.
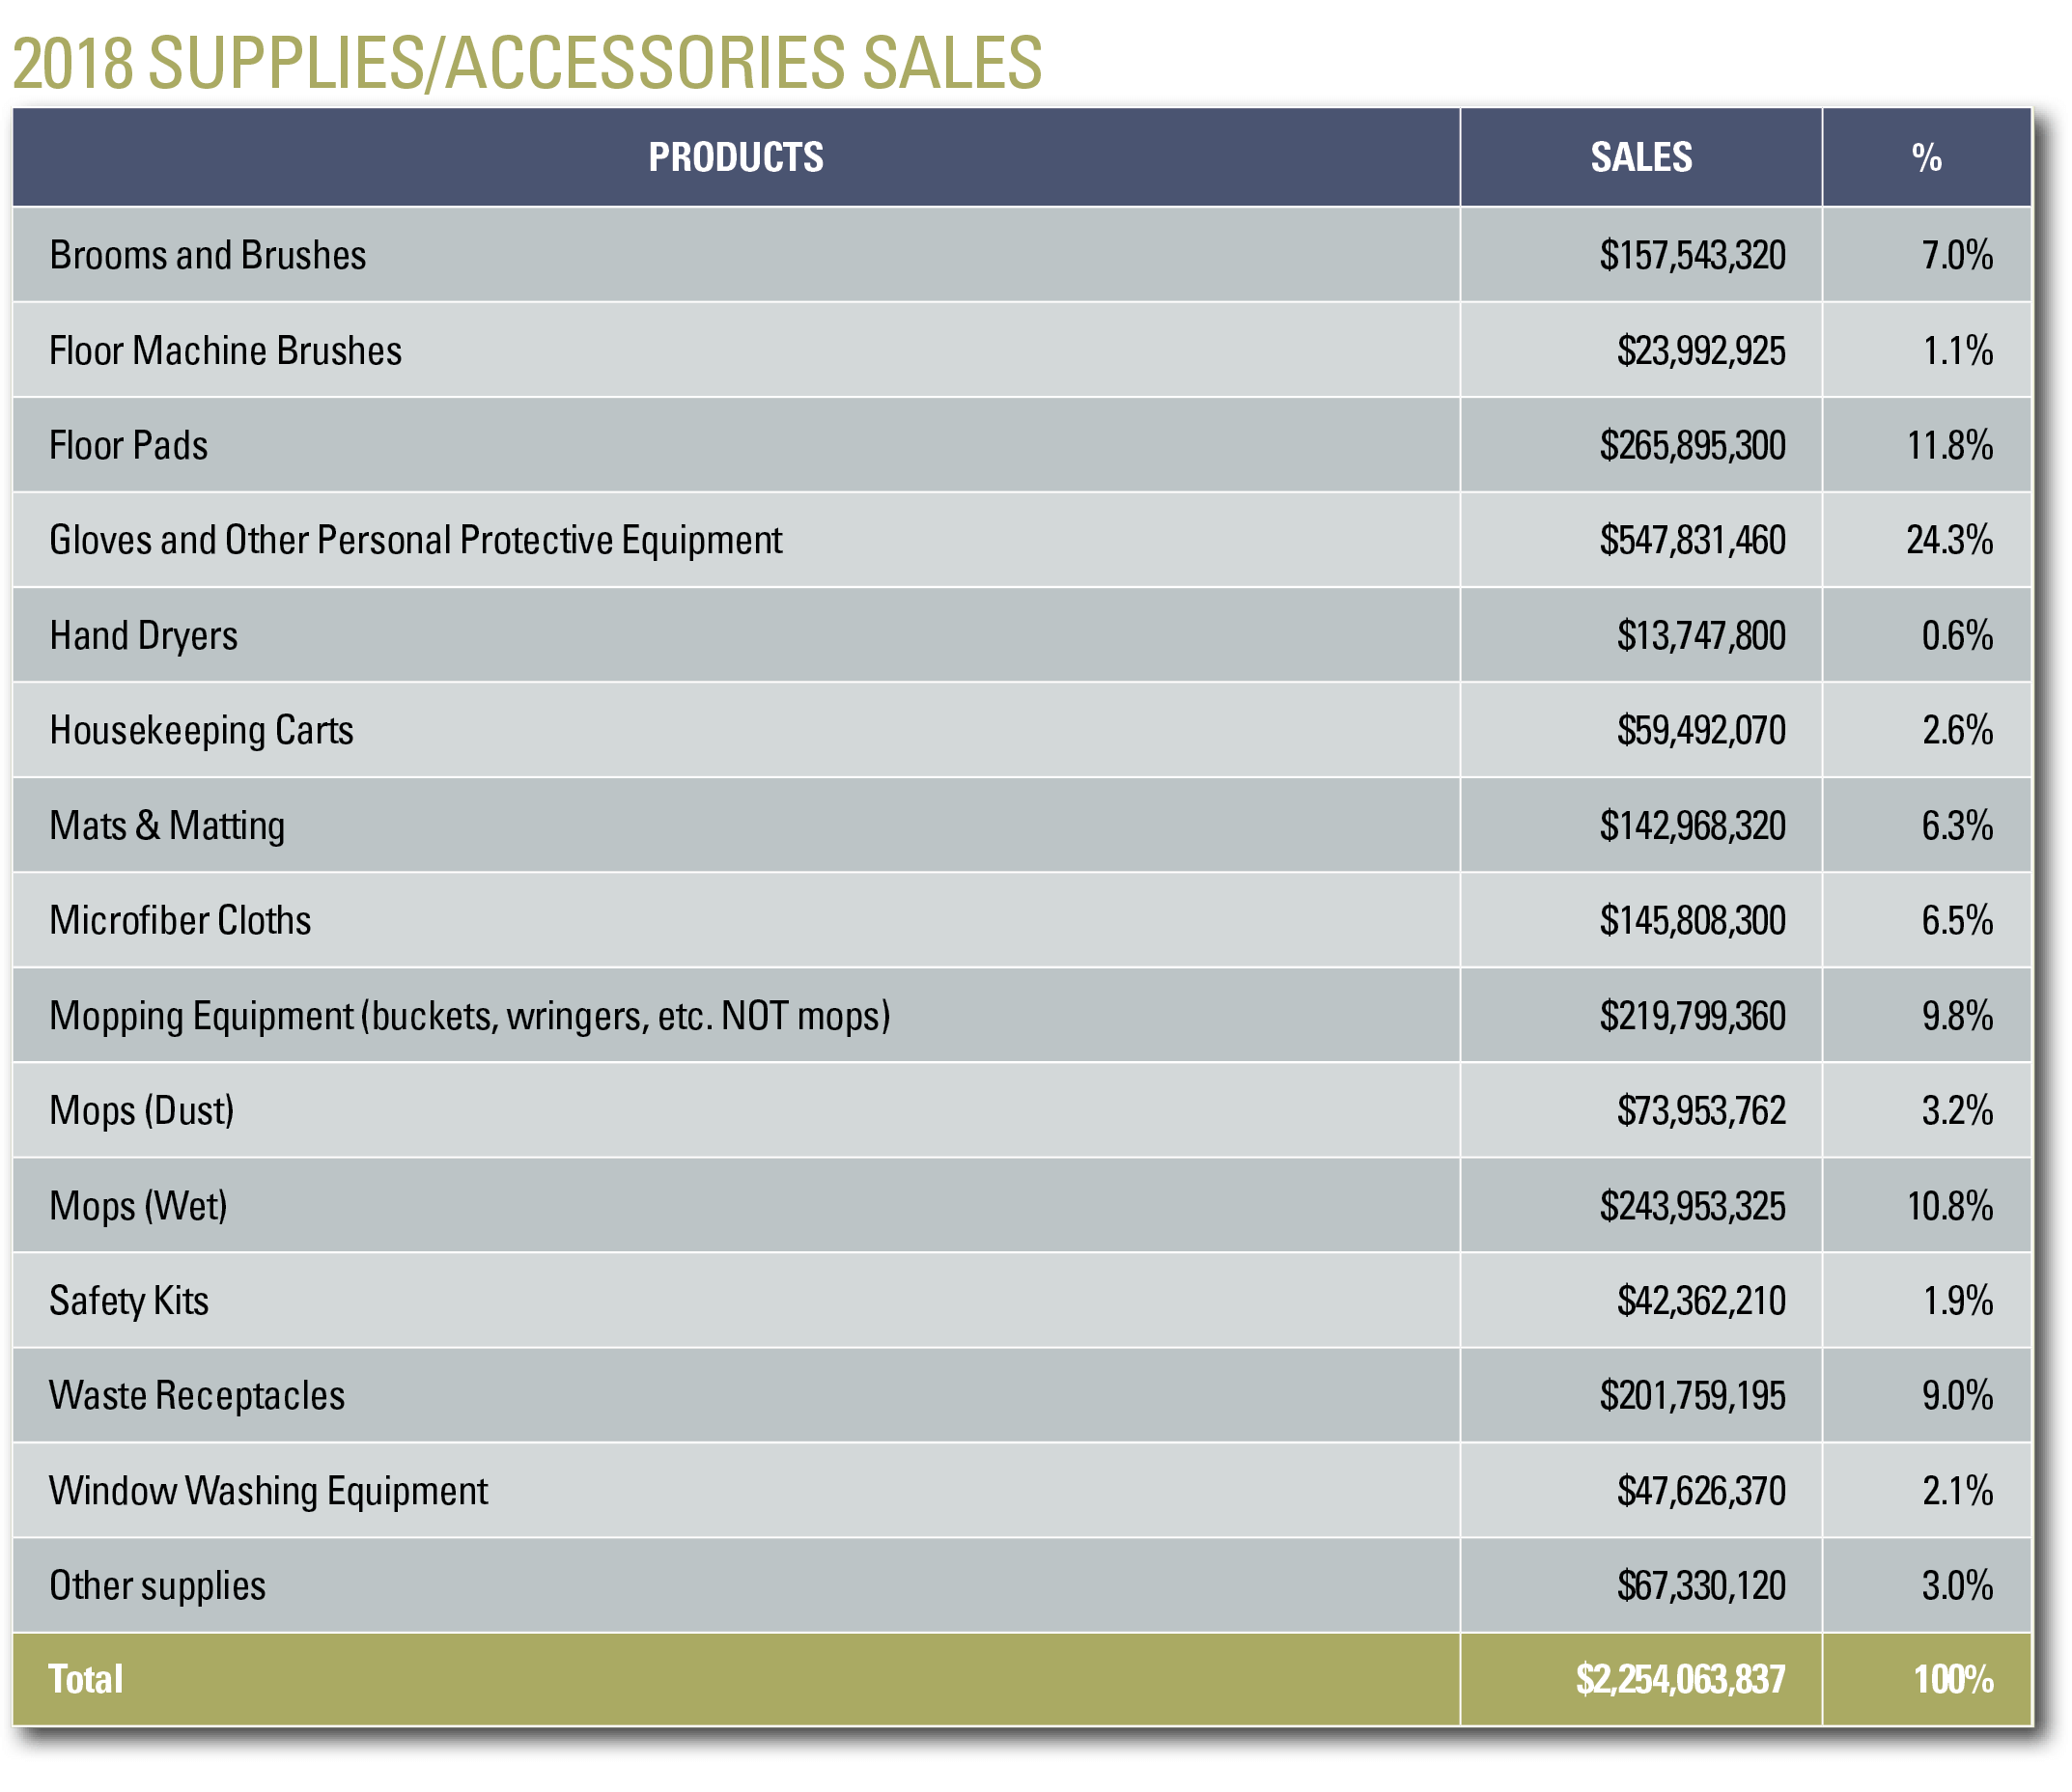
New technological innovations aren't the only products to see gains. Tried-and-true tools such as dust mops and wet mops also saw large increases from 2016 figures. It's easy to see why when looking at the cleaning frequencies facility executives spec in their buildings. According to the "Cleaning Costs and Frequencies Report" published by Contracting Profits, Facility Cleaning Decisions and BSCAI, 65 percent of multi-tenant offices, 80 percent of K-12 schools, 85 percent of colleges/universities and 90 percent of hospitals all have floors mopped daily or multiple times a day.
Distributors who consider jan/san to be their secondary product category make up nearly 20 percent of the survey respondents. Surprisingly, this is a lower number than past surveys, and yet diversified product categories still saw growth over 2016 figures. Even though cleaning supplies represent the bulk of their sales, distributors see value in diversifying product lines to grow revenue. Warewashing equipment, laundry chemicals and foodservice disposables all increased compared to 2016 numbers.
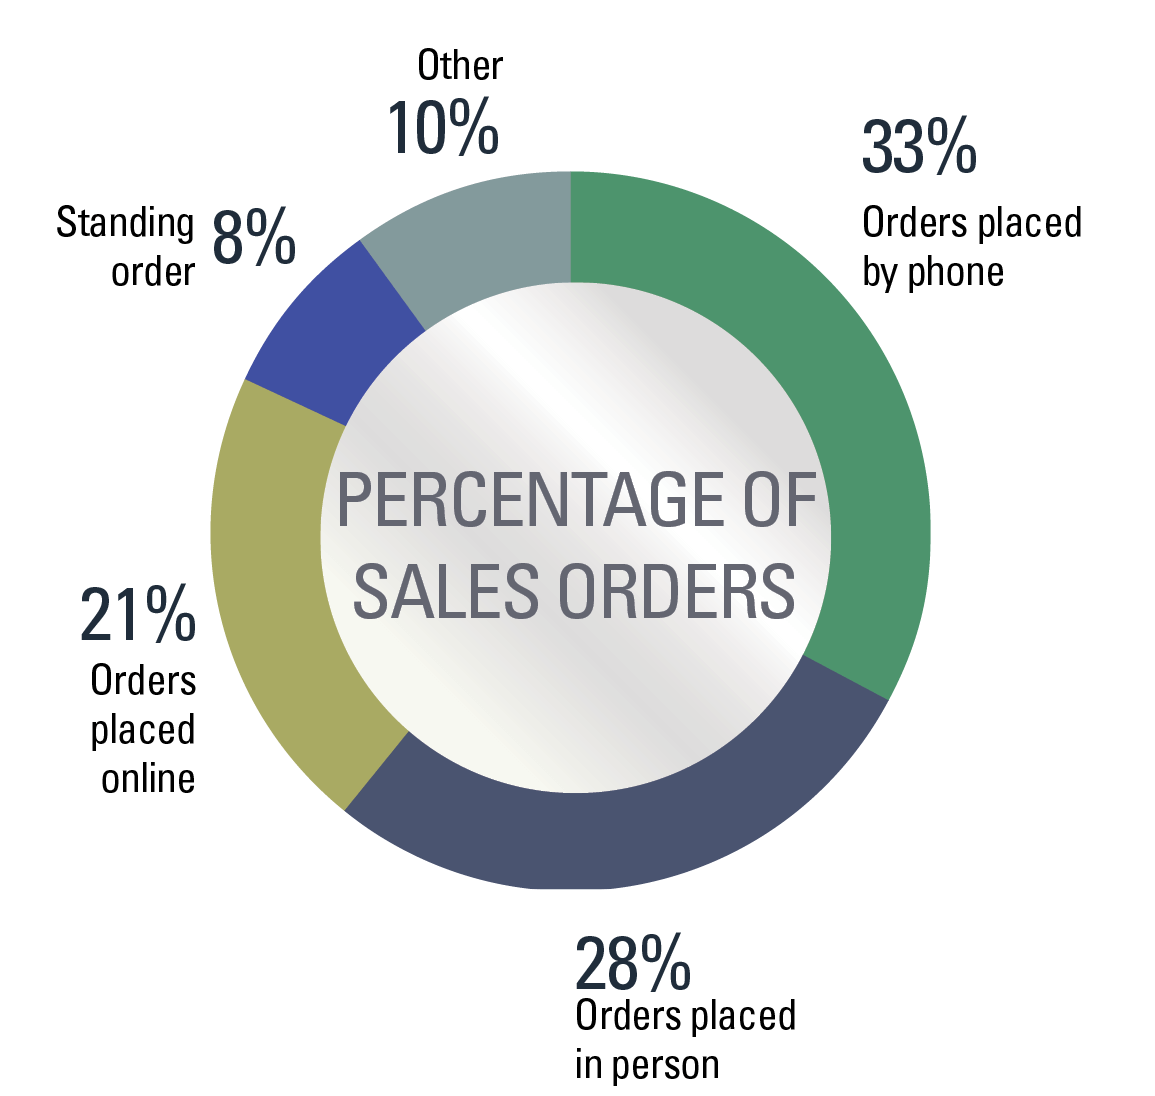
When looking at how customers are placing orders, this year's "Report On Sanitary Supply Distributor Sales" only takes into account respondents who consider themselves primarily jan/san distributors. That said, calling a sales rep still remains the most common way end users place an order.
In this digital age, one might expect online orders to be higher than just 21 percent. However, according to a 2017 survey by Essendant, 11 percent of jan/san distributors didn't have a website and barely half had a site with e-commerce abilities that allowed clients to place an order. Fast-forwarding to 2018, it's doubtful these figures increased much in only one year's time. In addition, in 2018, 24 percent of BSCs didn't buy any of their products online, and 29 percent purchased only 10 percent or less of their products this way, according to the "2018 Report On The Building Service Contractor Market." As for in-house customers, only half purchased some of their products via a distributor's website, according to the "2018 Annual Facility Cleaning Decisions Management Survey."
Additional Sales Information Breakdown:
By Janitorial Supply Distributors Only

 The Down and Dirty on Cleaning in Virus Season
 How Surfactant Use is Expanding in Commercial Cleaning
 Maximize Your Margins: Learn How to Automate Pricing and Track Rebates